Lise Stork, VUA.
Why are the neighbourhoods in some cities sharply divided along income boundaries, while in other cities not? Was this always the case in different periods of history? And in different cultures? Has social mobility increased or decreased over time? Why does life expectancy correlate with income?
Disparities in income and opportunity for personal development are continuous sources of frustration and social divide. The deeply unequal global landscape of modern society increases the importance of studies into the origins and persistence of inequality. To this end, the MUHAI project aims to develop a technological infrastructure to aid social scientists with the generation and explanation of research hypotheses. In building such a “social observatory” the emphasis lies on cooperation between human and system, where capabilities of both complement one another.
Social scientists commonly search for indicators that contribute to or cause the origins or persistence of inequality between social groups. They do this by taking a close look at data that describe the results of societal mechanisms, such as the division of labour and income. At the Dutch International Institute of Social History (IISH) for instance, social scientists investigate the global development of labour and labour relations. For this purpose, they collect, process and link historical archives such as handwritten census, accounts of the history of municipalities, registers of births, marriages and deaths, tax surveys, and historical maps.
Research into historical datasets is challenging on multiple levels. For example: the meaning of occupations and other concepts change over time, datasets often contain biases whenever data are collected in specific regions or among certain social groups (for instance only among those that earn more than the marginal income), and although it is possible to detect certain trends computationally, finding an understandable explanation for the cause of such trends seems an insurmountable task.
Knowledge graphs are interconnected networks of data that represent historical facts and knowledge about social phenomena and everyday life. In such graphs, nodes represent real-world entities such as events, locations, or individuals of a population, and edges indicate their relationships with other entities, such as the age or birthplace of a specific individual, e.g., person → livesIn → Paris. Researchers from the IISH routinely analyse these graphs to discover patterns and find explanations for social phenomena such as socio-economic inequality. Using different techniques that will range from statistical techniques such as deep neural networks, to symbolic techniques such as automated reasoning, we will aid them with this process by discovering new knowledge, detecting clusters or trends, and most importantly, by formulating sensible causal explanations of such clusters and trends. A typical example would be the question why in 1814, the marriage numbers in France were double that of the years before and after? The explanation for this is that Napoleon issued a law, requiring all men who were unmarried by 1815 to join the army, so a lot of marriages were hastily arranged in 1814!. Our ambition is to develop human-centered AI techniques that can uncover such explanations by working in collaboration with social scientists.
So, rather than simply uncovering statistical patterns, we aim at creating a social observatory that provides social scientists with human understandable explanations of trends, such that scientists can turn these explanations into testable hypotheses, and obtain a deeper understanding of the value of certain hypotheses and potential sources of reasoning errors, such as selection bias and missing information. The aim of this observatory is therefore not to replace human capabilities, but to enhance them, with the MUHAI tools working in collaboration with them. Through the creation of understandable narratives of social inequality, researchers can improve and accelerate their research and paint a picture of general societal processes that cause long-standing societal inequality.
The Florentine Catasto of 1427
The Catasto is a tax assessment of the inhabitants of Florence and its surrounding territories between 1427 and 1429. In the Catasto, officials listed the wealth, debts, and assets of households in the Republic of Florence. Unlike many premodern tax assessments - which only taxed the rich - the Catasto aimed to include all households within the Republic. The Catasto allows to examine the relation between household size and wealth. In the city of Florence this relation was quite positive:
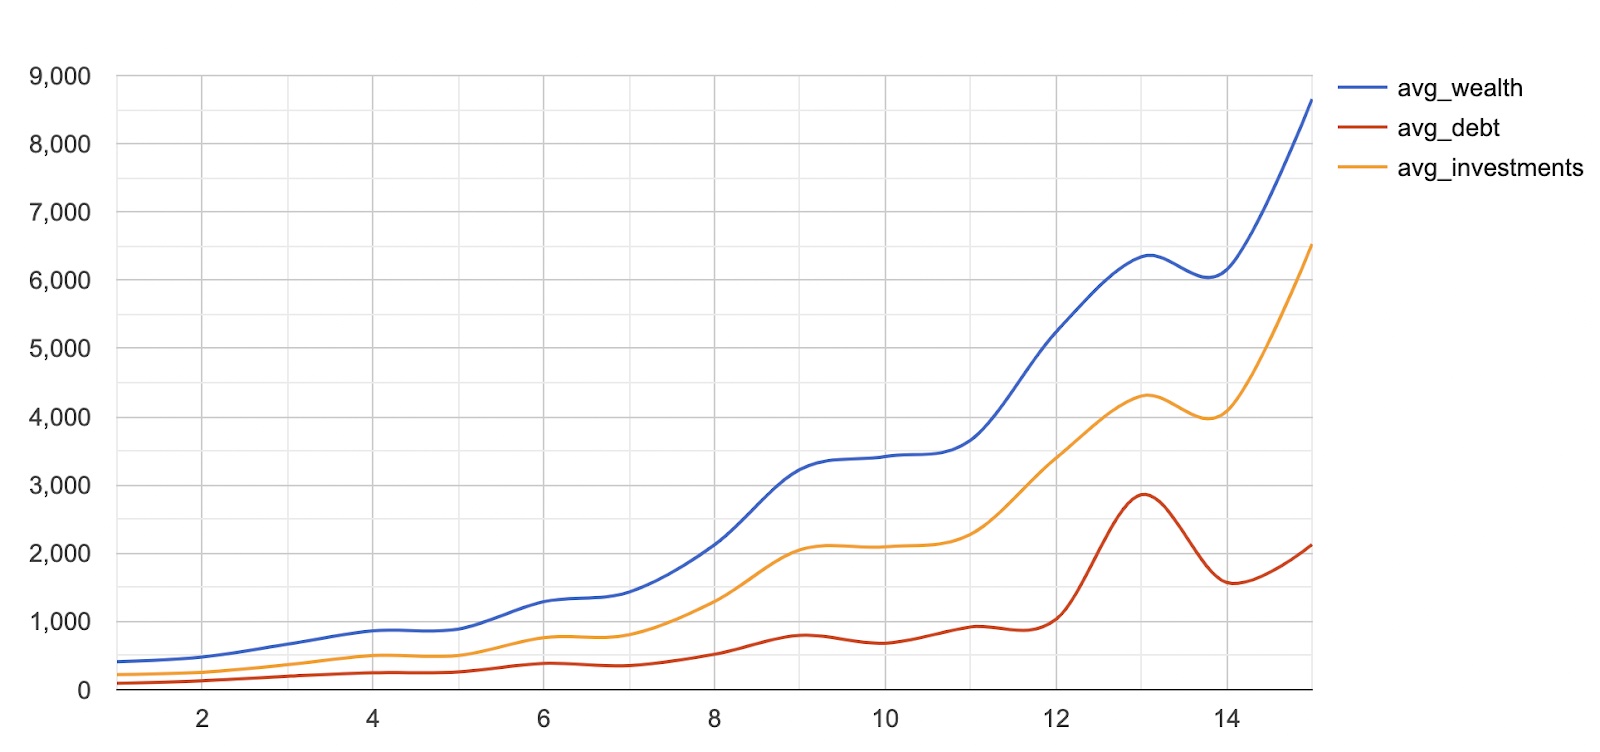
How can this correlation be explained? Were these households large because they could afford it, or were poor households also large because many family members were living under one roof?
Source: https://stories.datalegend.net/catasto/

Study without ChatGPT… to work more wisely with AI

From digital archives to online observatories, the peaks and chasms of social-media based research Pt.3

From digital archives to online observatories, the peaks and chasms of social-media based research Pt.2

From digital archives to online observatories, the peaks and chasms of social-media based research Pt.1

A Digital Assistant for Scientific Discovery in the Social Sciences and Humanities

Narrativizing Knowledge Graphs

Economists’ inequality narratives (on Twitter) before and after the COVID-19 outbreak

Making sense of events within a story
